Check out your data pipeline health dashboard
Hey there, Emre.
- Product
- RudderStack
- Sent from
- rudderstack.com
- Sent
No dark-mode styles — this email renders the same in a dark client.
****************
Hey there, Emre.
****************

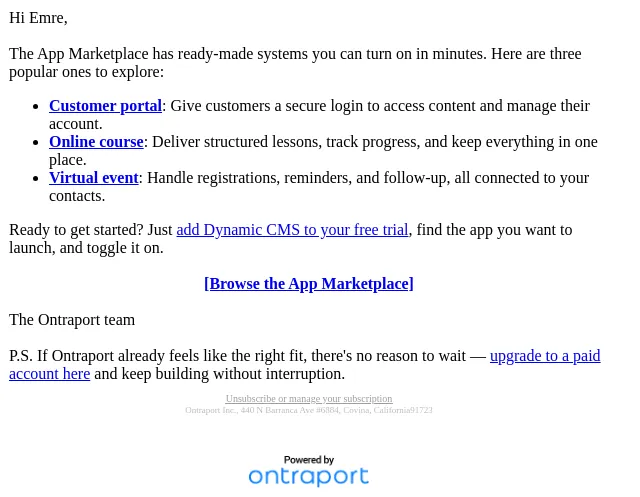
Once you've got data pipelines setup, the next question is the one that matters most in production: is the data actually arriving, clean and complete?

That's what the Health Dashboard answers. It's a single pane of glass across your Event Stream, Reverse ETL, and Tracking Plans, so you're not stitching together logs to find out.

Here's what you can do with it in about two minutes:

* See delivery at a glance — events delivered, failures, and failure rate per destination, with this period compared to the last so trends jump out.
* Zero in on what's broken — filter to just the destinations with failures, across cloud and warehouse.
* Debug without guessing — click any failure to see the real error message and a sample of the failed event payload. No reproducing, no spelunking.
* Retry in one click — re-run failed warehouse syncs directly from the dashboard.
* Catch bad data early — spot tracking plan violations before malformed events spread into your warehouse and reports.
* Hear about issues first — set alerts to Slack, email, or webhook so you find out before your stakeholders do.

Find it under Monitor → Health in the left nav or click-through here:

See Health Dashboard ( https://app.rudderstack.com/healthDashboard )

Please reach out if there is anything we can do to help!

Brooks

P.S. You've got 17 days left in your trial.
- Accession
- nse/rudderstack/2026-09-13/1403
- From
- Brooks Patterson · brooks@rudderstack.com
- Sent
- 13 September 2026 · 16:00 UTC